
Figure 1.
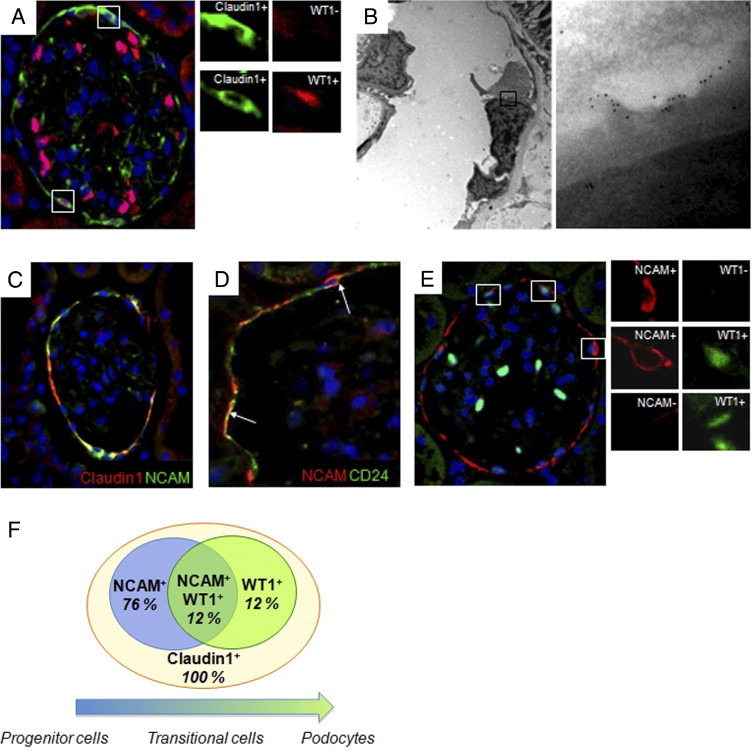
Populations of cells lining the Bowman's capsule of normal adult rat kidney. A: Representative picture of immunofluorescence staining of claudin1 (green) and WT1 (red) in the Bowman's capsule of Wistar rats used as controls. High-magnification insets show claudin1+WT1− cell (upper insets) and claudin1+WT1+ cell (lower insets). B: Representative pattern of immunogold labeling for nephrin in the Bowman's capsule of Wistar rats. Left panel shows the ultrastructure of parietal cells along the Bowman's capsule. High-magnification inset (right panel) shows that gold particles are localized along the foot processes of parietal cells. Original magnification: ×4400 (left panel); ×71,000 (right panel). C: Double immunolabeling for claudin1 (red) and NCAM (green) shows in most of the cells the colocalization of the two markers. D: Double immunofluorescence staining for NCAM (red) and CD24 (green) revealed that in the Bowman's capsule, the two antigens are expressed by the same cells (arrows). E: Representative photomicrograph showing three distinct cell populations in the Bowman's capsule of Wistar rats, identified by staining of NCAM (red) and WT1 (green): NCAM+WT1− progenitor cells (upper inset), NCAM+WT1+ transitional cells (middle inset), and NCAM−WT1+ parietal podocytes (lower inset). Original magnification, ×630. F: Schematic representation of the cell populations identified in the Bowman's capsule of Wistar rats. All of the cells were positive for PEC marker claudin1. A gradient of expression of NCAM and WT1 defined three populations of claudin1+ PECs with different degrees of differentiation. Seventy-six percent expressed only the progenitor marker NCAM, 12% expressed NCAM and the podocyte marker WT1, and 12% both progenitor and podocyte markers.