
Figure 4.
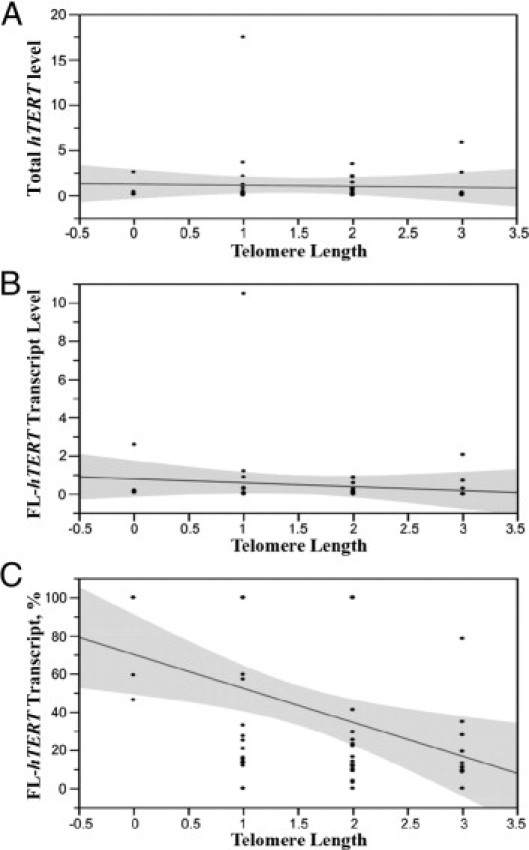
Correlation between hTERT variant expression and telomere length in thyroid tumors. Scatterplots showing the bivariate linear fit and 95% confidence intervals between hTERT levels and telomere length assessed by FISH analysis are shown. A: Total hTERT expression assessed by quantitative RT-PCR. Spearman's correlation coefficient was −0.1 (P > 0.5). B:hTERT full-length transcript levels assessed by quantitative RT-PCR. Spearman's correlation coefficient was −0.3 (P > 0.06). C: Percentage of full-length transcription expression. Spearman's correlation coefficient was −0.4 (P < 0.0041).