
Figure 5.
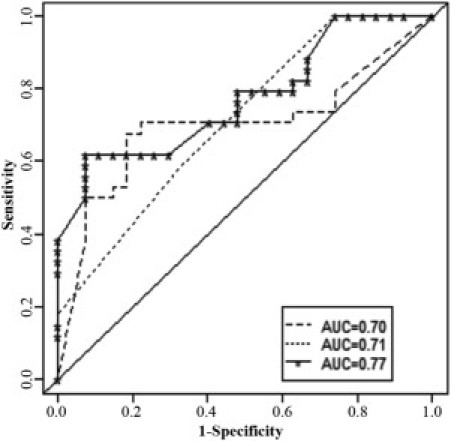
ROC analysis of %FL-hTERT and telomere length. ROC curves for distinguishing malignant versus benign thyroid tumor types using %FL-hTERT expression (dashed line), telomere length (dotted line), and combined %FL-hTERT expression and telomere length (solid line). The diagonal line denotes an AUC = 0.50.