
Figure 1.
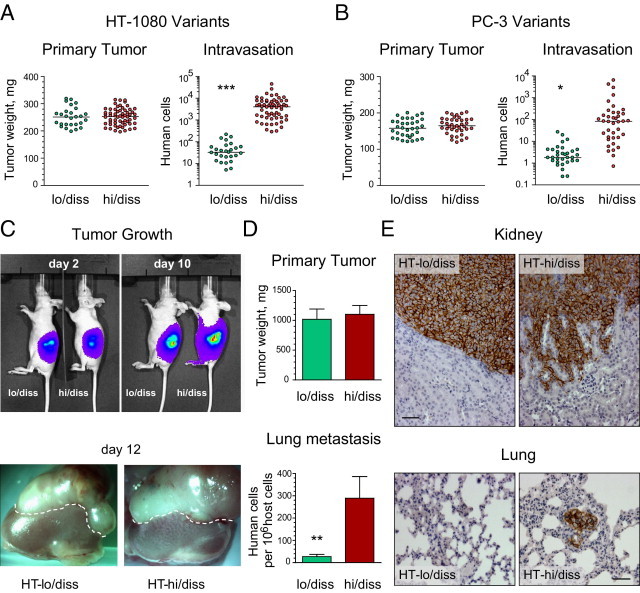
Dissemination capacity of HT-1080 and PC-3 variants in spontaneous metastasis models. A and B: Tumor growth and intravasation in the chick embryo model. The levels of intravasation of HT-1080 fibrosarcoma (A) or PC-3 prostate carcinoma (B) variants were determined using Alu quantitative PCR in the embryos bearing primary tumors of similar size. Note the logarithmic scale in the intravasation scattergrams. The scattergrams represent cumulative data from nine independent experiments involving grafting of HT-lo/diss (n = 27) and HT-hi/diss (n = 60) and five independent experiments involving grafting of PC-lo/diss (n = 34) and PC-hi/diss (n = 39). ***P < 0.001, two-tailed Student's t-test. C–E: Tumor growth and metastasis of HT-1080 variants in the kidney capsule xenograft model. C: Tumor development of HT-lo/diss and HT-hi/diss variants was analyzed by noninvasive imaging of firefly luciferase-tagged cells using the IVIS system at 2 and 10 days after cell implantation under the renal capsule of immunodeficient mice (top panels). Kidneys with developed tumors were excised from the mice on day 12. Dotted line demarcates the border between the primary tumor and the top of the kidney (bottom panels). D: Efficiency of the primary tumor growth was determined after subtracting the weight of the contralateral kidney. Data from one of six individual experiments involving mice bearing HT-lo/diss (n = 4) and HT-hi/diss (n = 6) tumors (top graph). Levels of lung metastasis in mice bearing HT-lo/diss and HT-hi/diss tumors were quantified using Alu quantitative PCR (bottom graph). Data are given as mean ± SEM from a representative experiment. **P < 0.05, two-tailed Mann-Whitney U-test. E: Immunohistologic detection of human tumor cells within mouse tissues was performed using human-specific CD44 antibody (brown). Top panels: High levels of tumor cell invasion in HT-hi/diss xenografts as compared with their lo/diss counterparts. Scale bar = 50 μm. Bottom panels: Metastatic cells (brown) were detected in the lung from a mouse bearing an HT-hi/diss tumor. Scale bar = 50 μm.