
Figure 2.
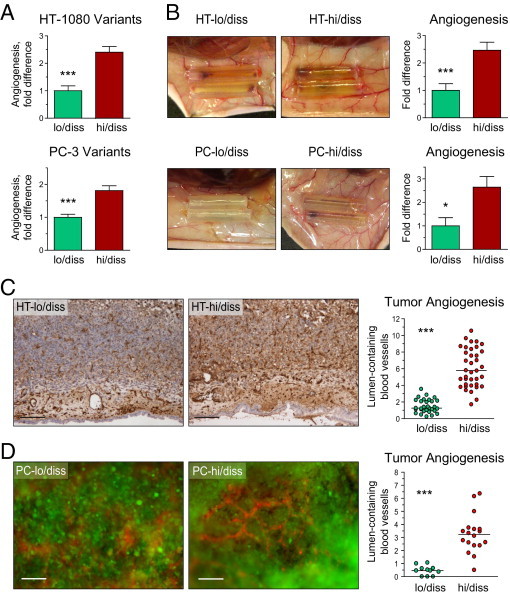
Angiogenesis induced by HT-1080 and PC-3 dissemination variants in avian and mammalian models. A: Angiogenic potential in the chick embryo collagen onplant model. Angiogenic potential of hi/diss variants of HT-1080 fibrosarcoma and PC-3 prostate carcinoma were quantified as fold differences between angiogenic indexes determined in individual onplants compared with their corresponding lo/diss counterparts. Cumulative data from three HT-1080 and five PC-3 independent experiments involving 30 to 79 individual onplants per variant are given as mean ± SEM. *P < 0.05, ***P < 0.001, two-tailed Student's t-test. B: Angiogenic potential in the mouse angiotube model. Panels depict blood vessels converging onto angiotubes. Bar graphs on the right depict fold difference in angiogenesis levels between tumor variants as determined by hemoglobin content in the tubes from three HT-1080 and two PC-3 independent experiments involving 7 to 18 mice per tumor variant. C and D: Tumor angiogenesis in primary CAM tumors. Primary tumors that developed in the chick embryos from HT-1080 variants (C) or PC-3 variants (D) were stained with endothelial cell–specific lectins (SNA or LCA) to visualize blood vessels. Immunohistochemical staining of HT-lo/diss and HT-hi/diss tumors with SNA lectin (C) was followed by quantifying the density of lumen-containing vessels, presented as the scattergram on the right. Scale bar = 100 μm. Number of sections analyzed from three to five individual tumors: HT-lo/diss, n = 30; HT-hi/diss, n = 38. Tumor blood vessels in primary PC-lo/diss and PC-hi/diss tumors were highlighted with red fluorescent-tagged LCA injected into live embryos (D). Scale bar = 100 μm. Quantification of tumor angiogenesis was performed in SNA-stained tumor sections. Number of sections was analyzed from four or five individual tumors: PC-lo/diss, n = 11; PC-hi/diss, n = 18. ***P < 0.001, two-tailed Student's t-test.