
Figure 4.
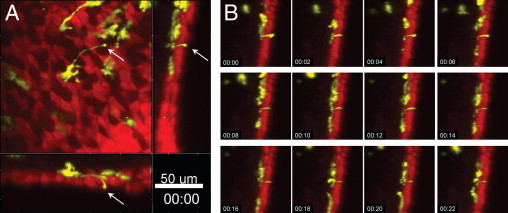
Projection of transepithelial extensions. Two-photon microscopic images of the airway mucosa with CD11c-EYFP+ DCs (yellow) located within and beneath the epithelium (red), revealed by SNARF-1 staining. A: CD11c-EYFP+ DC forming an extension across the epithelium (arrows). Maximum-intensity projections along the z-axis (top view) or the x- and y-axes (side views, representing only a few optical section). Scale bar = 50 μm. B: Image sequence (see Supplemental Video S5 at http://ajp.amjpathol.org) showing the corresponding side view in A, indicating the dynamic activity of the transepithelial DC projection. Time scale is shown as hh:mm.