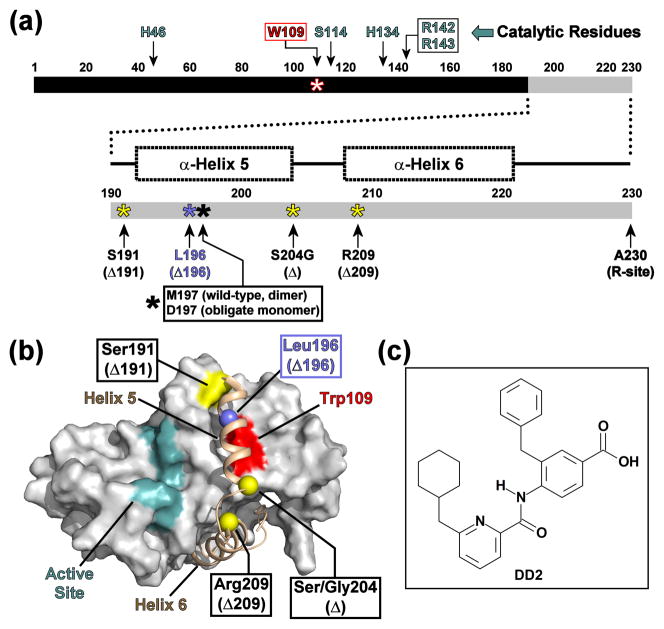
Fig. 1. Domain diagram of KSHV Pr.
(a) Linear domain diagram of KSHV Pr displaying the positions of the “hot spot” Trp109 (red), catalytic residues (cyan) and the conformationally dynamic C-terminus (gray). C-terminal truncations are indicated by yellow or blue asterisks. (b) The dimer interface of a KSHV Pr monomer (2PBK). The partner monomer is omitted for clarity. The active site (cyan), the inhibitor-binding “hot spot” Trp109 (red), and truncation sites (yellow and blue balls) are indicated as in Figure 1a. See also Movie S1. (c) The chemical structure of DD2, an optimized analog of a first generation lead inhibitor of KSHV Pr.21

