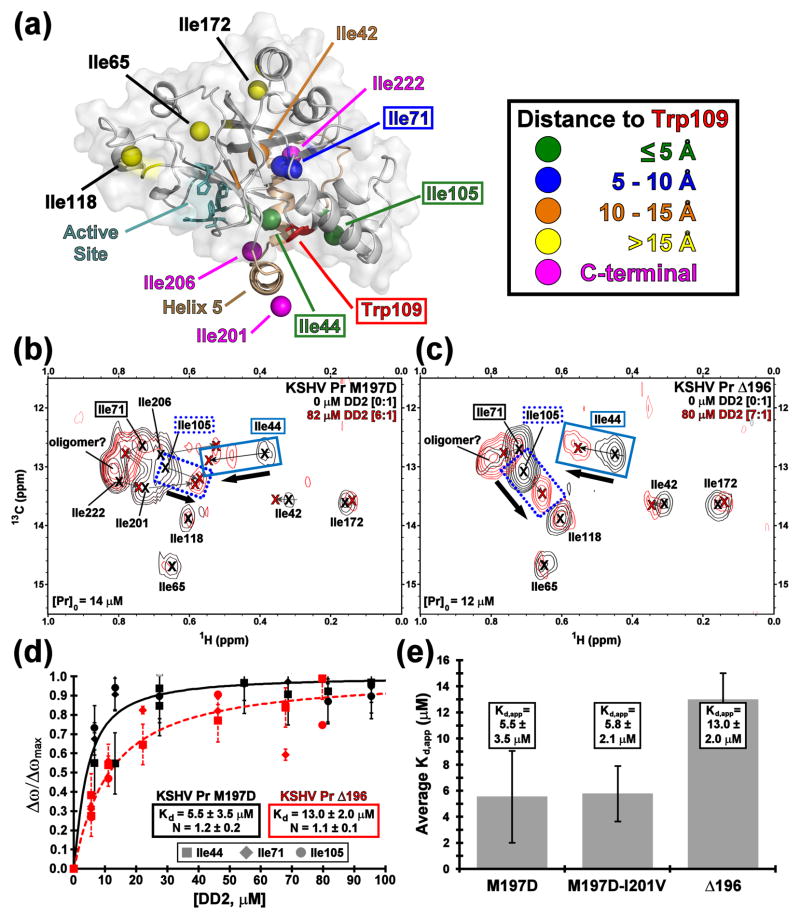
Fig. 2. KSHV Pr-DD2 titration.
(a) The distribution of isoleucine δ1-methyl groups on a full length KSHV Pr monomer structure, based upon 2PBK. The view is a 90 degree rotation about the horizontal axis, relative to that in Figure 1b. Isoleucines separate into five zones with respect to distance from Trp109 as indicated by colored balls. The 13C-1H HSQC titration spectra of the KSHV Pr M197D (b) and Δ196 (c) constructs with DD2, focusing on the isoleucine δ1-methyl region. The spectral overlays display apo (black) and > 5 molar equivalents DD2 (red). Ile44 (solid blue box), Ile105 (dotted blue box), and Ile71 (solid black box) are used as the binding probes. (d) The binding curves (M197D, solid black; Δ196, dashed red) represent the average apparent Kd values calculated for the three Ile probes, and are summarized as a bar chart (e). HSQC titration spectra and binding curves for the M197D-I201V construct are displayed in Figure S4.

