
Figure 3.
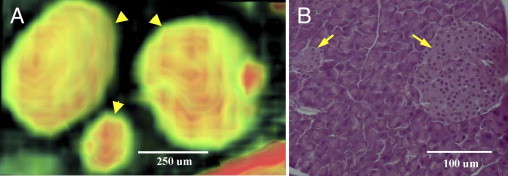
MRI and histology of islets in normal mouse pancreas. A: 3D volume-rendered μMRI image of islets in a normal mouse pancreas. The color gradient represents the magnetic resonance signal intensity gradient (green to red, low to high intensity). Note the varying intensity levels within each islet (arrowheads), which may reflect the presence of different cell types or microcirculation within pancreatic islets. B: H&E-stained histological image of islets (arrows) in a normal mouse pancreas. All tissue appears purple, with islets visible as round objects, slightly lighter purple, within the tissue. Acinar cells are visible surrounding the islets.