
Figure 5.
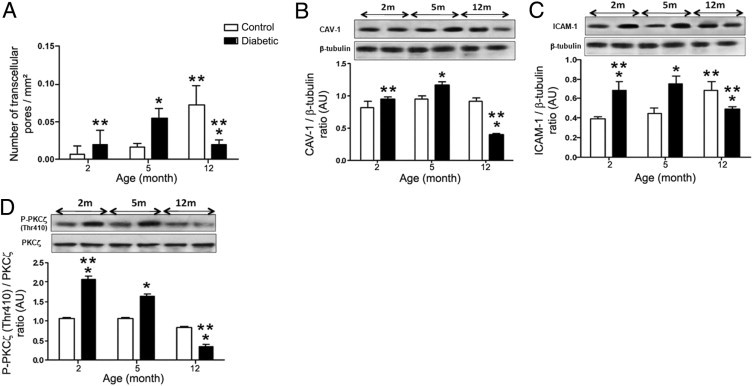
Quantification of the number of pores in RPE cells and CAV-1, ICAM-1, PKCζ expression in the time course of diabetes. A: Quantification of pores as a function of aging in control and diabetic GK rats. In diabetic rats, the density of pores increases with a maximum at 5 months of hyperglycemia (2.8-fold) and then decreases at 12 months (threefold). In control rats, pore density increases significantly only at 12 months (4.4-fold from 5 to 12 months) to reach a higher density compared with old diabetic rats (sevenfold). (n = 9 eyes per group). Number of transcellular pores was expressed as the mean number of pores/whole flat mount. *P < 0.05 versus control; **P < 0.05 versus 5 months. B–D: Western blot analysis for CAV-1 (B), ICAM-1 (C), and P-PKCζ (Thr 410) (D) expression in RPE/choroid from 2-, 5-, and 12-month control and diabetic rats. The ratio of CAV-1/β-tubulin, ICAM-1/β-tubulin, and P-PKCζ(Thr 410)/PKCζ were calculated. In diabetic rats, ICAM-1 and CAV-1 increased significantly during the early phase of diabetes (2 and 5 months of hyperglycemia) and then decreased at 12 months. PKCζ activity evaluated by Thr 410 immunodetection (D) showed the same timing of expression as CAV-1 and ICAM-1. In control rats, ICAM-1 significantly increased at 12 months (C). *P < 0.05 versus control; **P < 0.05 versus 5 months.