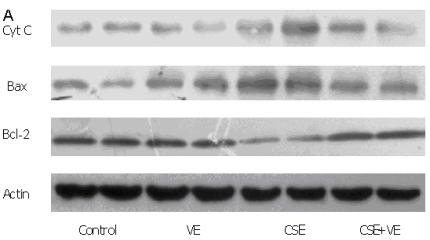
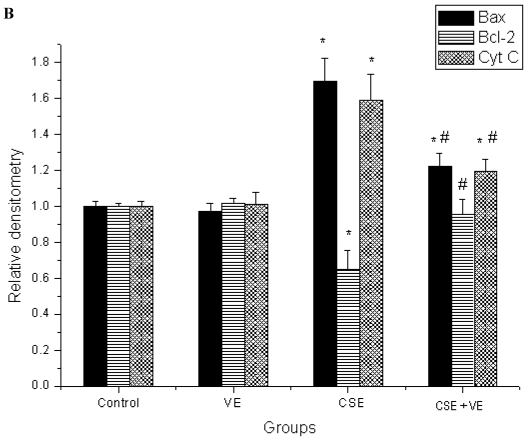
Figure 9.
Release of mitochondrial cytochrome c and expression of Bax and Bcl-2 in ELCs. The proteins from the cytosolic cell lysate (for cytochrome c) and whole-cell lysate (for Bax and Bcl-2) were analyzed by Western blotting. Actin was used as an internal control. The data represent the mean ± SD from 3 independent experiments. (A) The representative pictures for Western blotting in different groups. (B) Expression of proteins of the relevant apoptosis genes in ELCs. * P < 0.05 vs control group, # P < 0.05 vs CSE group. VE: 100 μmol/L VE treatment group, CSE: CSE (equivalent to 200 ng/L nicotine) treatment group, CSE+VE: 100 μmol/L VE + CSE (equivalent to 200 ng/L nicotine) treatment group.


