
Figure 3.
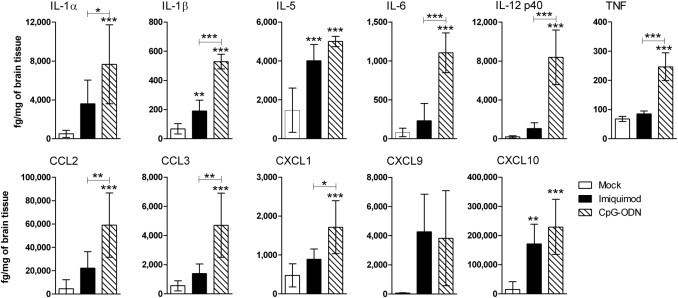
Comparison of proinflammatory cytokine responses after imiquimod or CpG-ODN inoculation in the brain. Mice were inoculated ICV with 100 nmol imiquimod or 80 pmol of CpG-ODN as described in Materials and Methods, and brain tissues were removed at 12 hpi. One half of the sagittally divided brain was homogenized in lysis buffer containing protease inhibitors and was analyzed for protein expression using a multiplex bead assay. Samples were calculated as picograms per milliliter using a standard curve from in-plate standards and were subsequently converted to femtograms per milligram of brain tissue. Data are the mean ± SD for four to eight mice per group. Statistical analysis was completed by one-way analysis of variance with Newman-Keuls posttest. *P < 0.05, **P < 0.01, and ***P < 0.001. Asterisks above bars indicate a significant up-regulation compared with mock-treated controls. Horizontal lines beneath asterisks indicate the difference between the indicated groups.