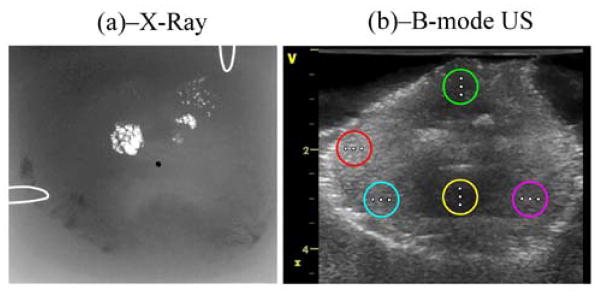
Fig. 2.
Prostate imaging with two modalities: (a) corresponds to an X-ray fluoroscopic image in which clusters of calcifications appear as bright spots. The urethra is also shown as a black dot at the center of the image. (b) corresponds to a conventional B-mode ultrasound image in which 5 regions were selected and shown as colored circles. SDUV excitation points are shown as white dots on the figure. The image size is (HxW≈) 4.5×5 cm2.

