
Figure 1.
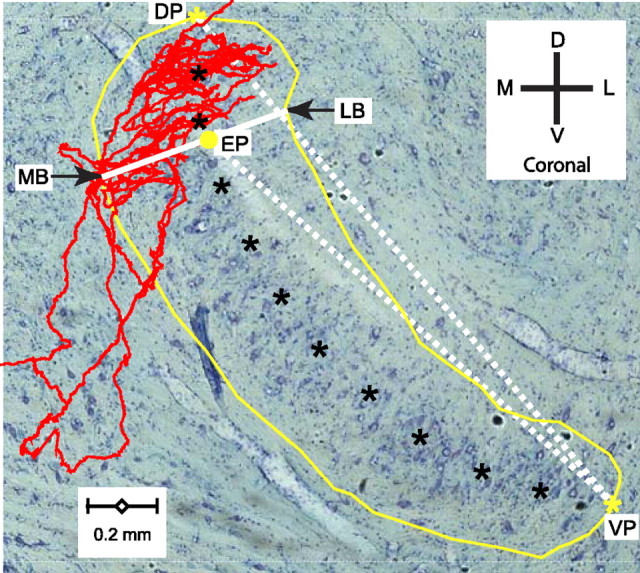
Illustration of measurements taken within sections. Coronal view of the contralateral projection of a traced fiber (CF, 1345 Hz) superimposed on a Nissl-stained single section, taken at the coronal level of the branch EP, indicated with the yellow dot. Yellow line, Contour of MSO on the section. Yellow asterisks, Most DP and most VP along the long axis of the MSO within the section, which is indicated with black asterisks. Drawing a line through the EP, which is approximately perpendicular to the long axis of the MSO, the arrows show the most medial and lateral points (MB and LB) of the MSO contour on this line. The two other lines (dotted white) indicate the Euclidian distances between EP and VP, and between VP and the DP of this section. Scale bar, 200 μm. Directions are indicated by the cross. D, Dorsal; V, ventral; M, medial; L, lateral.