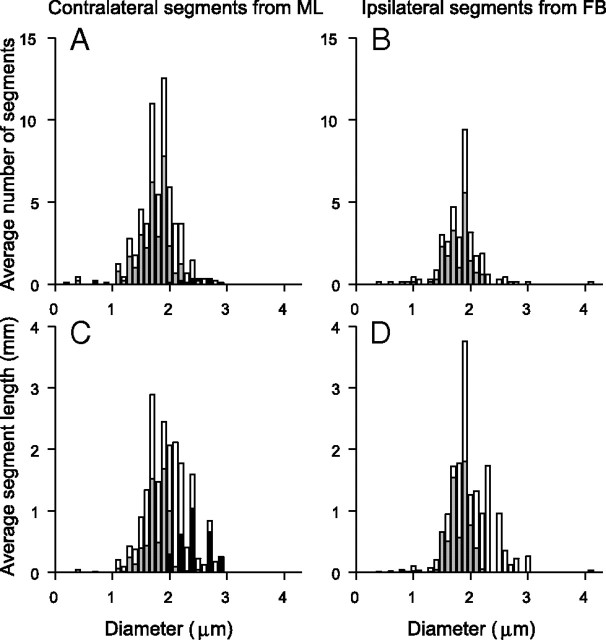
Figure 12.
A–D, Distribution of axon diameters does not differ between contralateral (A, C) and ipsilateral (B, D) projections. The top histograms show the average number of segments with a given diameter (0.1 μm bins); the bottom histograms show the corresponding average length (in mm) at that diameter. All histograms are averages calculated for the entire population of contralateral and ipsilateral fibers, normalized to the total number of fibers included. The starting segments were ML (contralateral fibers) and FB (ipsilateral fibers). White bars include all the segments from starting segment to endpoints. Gray bars show length of most distal segments, terminated by endpoints. Black bars show length of most proximal segments, which contain ML (contralateral fibers only).

