
Figure 13.
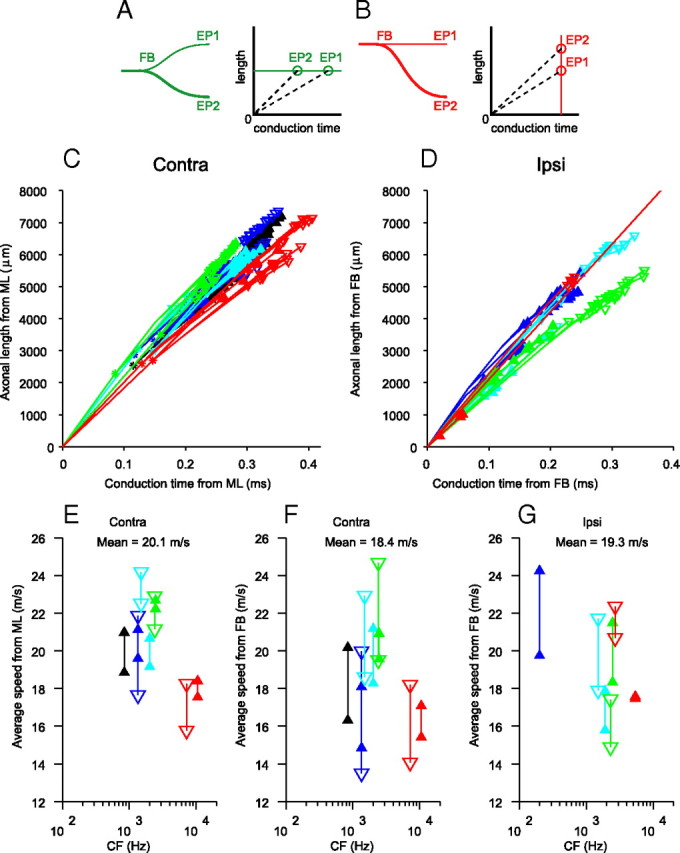
Axonal length is linearly related to estimated conduction time. Axonal lengths are measured as in Figures 7 and 11. Conduction time for each endpoint is the sum of conduction times of all segments leading up to that endpoint, calculated from segment length and diameter (see text). Diagrams in A and B illustrate configurations that would result in nonsloping relationships. C, Length and time for contralateral projections, using ML as reference point. D, Length and time for ipsilateral projections, using FB as reference point. One outlying endpoint is clipped off. E, F, Estimated average conduction speeds for all endpoints. This is the slope of the lines connecting the endpoints in C and D with the origin at (0,0), as illustrated with the dashed lines in A and B. E–G, Reference point at (0,0) was ML (E) or FB (F, G). Color code and symbols are identical to Figures 8 and 10. The symbols indicate the lowest and highest speed for the endpoints of a given fiber.