
Figure 2.
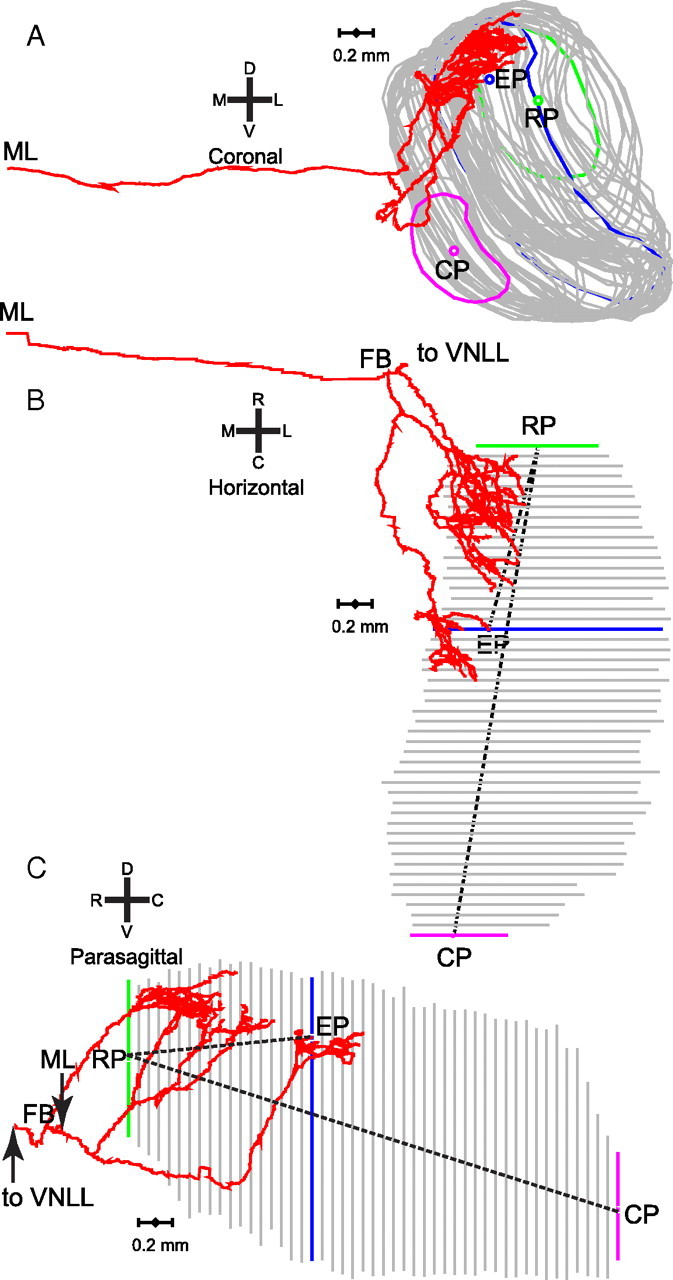
Example of the contralateral MSO innervation by one axon (same axon as in Fig. 1). A–C, Coronal (A), horizontal (B), and parasagittal (C) views are shown. The RP and CP were defined as the geometrical center of the most rostral (green line) and most caudal (magenta line) section, respectively. The rostrocaudal position of endpoints was quantified by measuring the Euclidian distance (dashed line) between RP and EP, and was normalized to the distance between RP and CP. The endpoint illustrated is the same one as in Figure 1; the MSO contour outlined in Figure 1 is shown in blue here. ML indicates the point at which the axon crosses the midline. CF of this fiber was 1345 Hz. A computer reconstruction of this fiber was also shown in Smith et al. (1993, their Fig. 4).