
Figure 7.
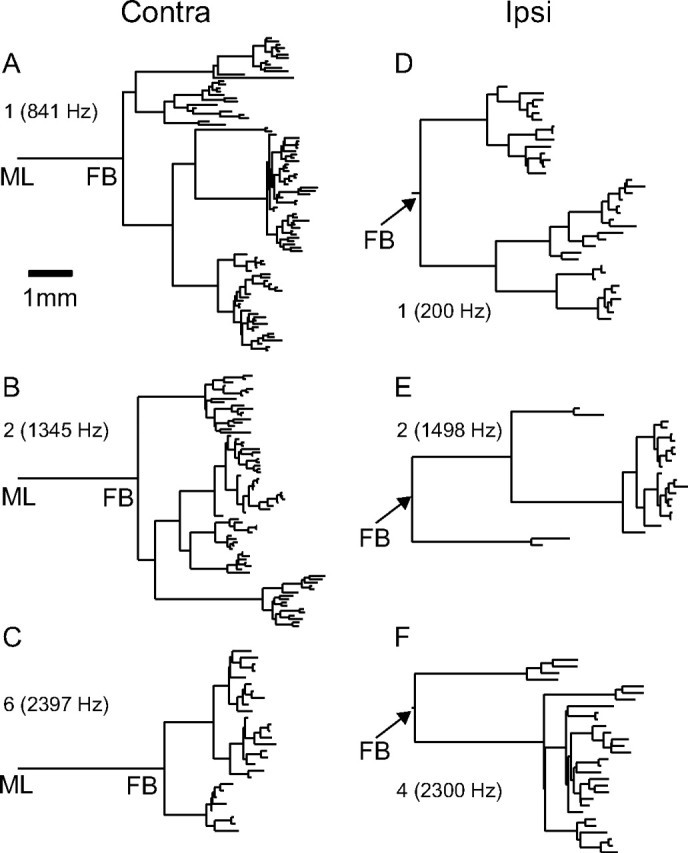
A, B, Dendrograms showing the branching pattern and length of axonal segments for three contralateral (A) and three ipsilateral projections (B). The scale bar in A applies to A–F. The horizontal dimension represents the axonal length of branch segments; the vertical dimension is only used to offset these segments and has no meaning with regard to length or order. Fiber number and CF are indicated for each projection. Cross-linking to previous figures with computerized reconstructions is as follows: A = Figure 4A; B = Figures 1 and 2; C = Figure 3A; D = Figure 5 of Smith et al. (1993); E = Figure 5; F = Figure 6.