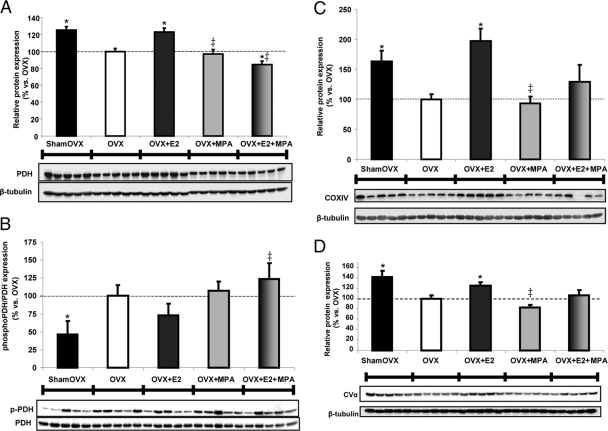
Fig. 3.
Medroxyprogesterone acetate inhibits the E2 potentiation of the protein profile of the bioenergetics-related panel. Total protein was isolated from hippocampus after 24 h exposure to (30 μg/kg), MPA (120 μg/kg), E2+MPA (30 μg/kg + 120 μg/kg), or corn oil vehicle control (OVX). Ovary-intact (shamOVX) rats served as a positive control and were selected on the morning after estrus by vaginal cytology. All immunoblot data were normalized to β-tubulin loading control and compared relative to OVX as 100% (except for the pPDH to PDH ratio, Fig. 4B). A, Expression of PDH, subunit E1α, was determined by Western blot analysis. Bars represent mean relative expression ± sem from five animals per group. *, P < 0.05 vs. OVX; ‡, P < 0.05 vs. E2 (n = 5). B, Expression of phosphorylated PDH, subunit E1α, was determined by Western blot analysis (phosphorylation inhibits PDH activity). Bars represent the mean ratio of pPDH to PDH expression ± sem from five animals per group. *, P < 0.05 vs. OVX; ‡, P < 0.05 vs. E2 (n = 5). C, Expression of COXIV was determined by Western blot analysis. Note that one band did not develop in the E2+MPA group and was excluded from the analysis. Bars represent mean relative expression ± sem from four to five animals per group. *, P < 0.05 vs. OVX; ‡, P < 0.05 vs. E2 (n = 4–5). D, Expression of complex V, subunit α, was determined by Western blot analysis. Bars represent mean relative expression ± sem from five animals per group. *, P < 0.05 vs. OVX; ‡, P < 0.05 vs. E2 (n = 5).

