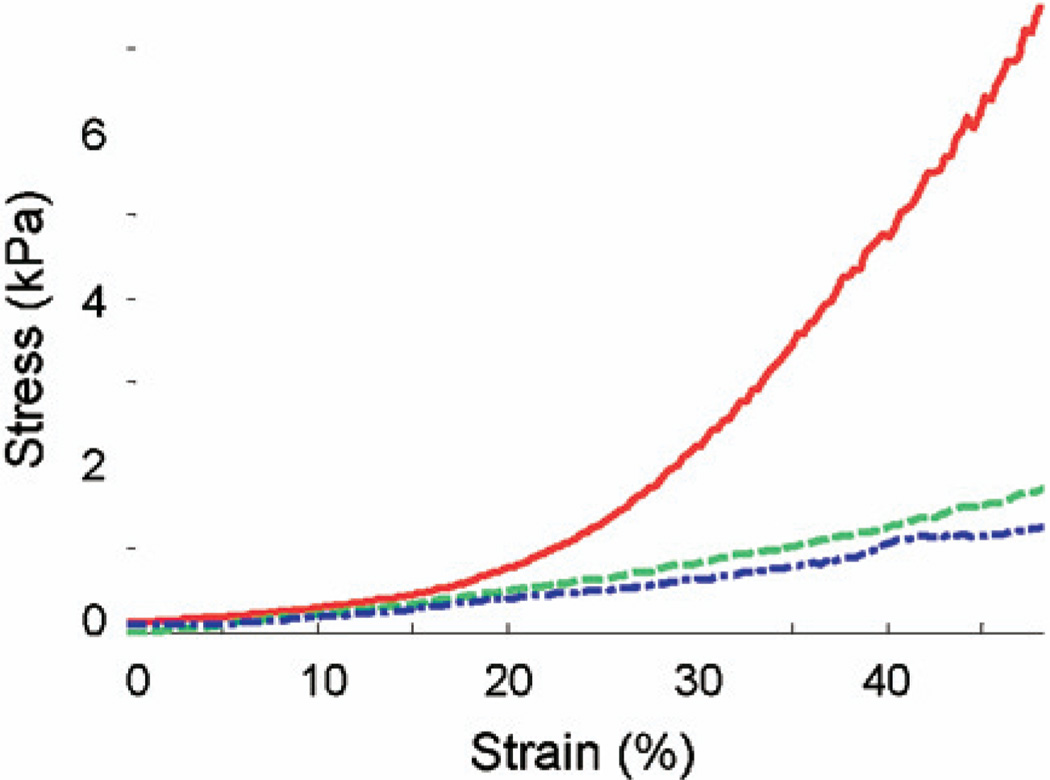
Fig. 6.
Direct mechanical measurement of the dissected tissues. The tissue samples are from the rats used for strain measurements presented in Fig. 3. Solid red: diseased area (distal) in a TNBS-treated rat (TNBS3 from study 2 in Table 1, 11.4 kPa); dash-dot blue: normal area (proximal) in the TNBS-treated rat (TNBS2 from study 1 in Table 1, 2.2 kPa); dashed green: normal area (distal) in a PBS control rat (PBS1 from study 1 in Table 1, 4.9 kPa). The elastic modulus was calculated by taking the slope of the linear fit of each curve within the strain range of 10% to 30%. Note that diseased tissue in TNBS-treated rat also demonstrates a high nonlinearity compared with a normal tissue from the TNBS-treated rat and PBS control rat.

