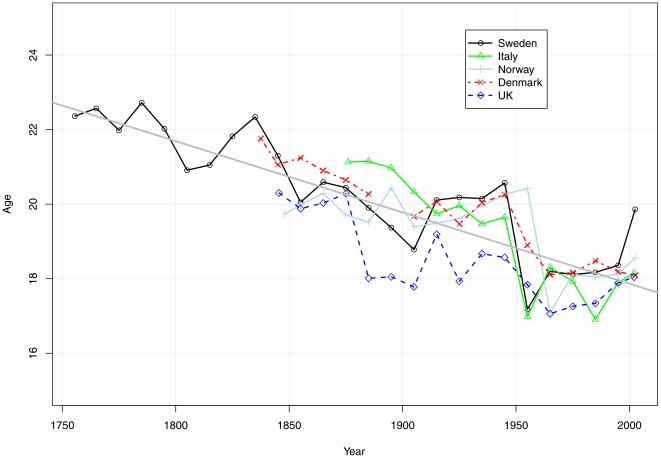
Figure 2. Estimated peak ages of male accident hump in various populations with high quality historical mortality records.
Source: Author's estimates from period decadal abridged mortality rates available at Human Mortality Database [15]. The points are plotted at the middle of the decadal intervals. The slope of the fitted straight regression line is -0.19 years per decade.

