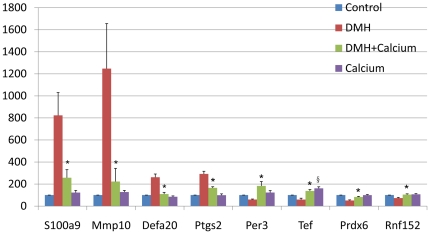
Figure 2. Validation of differentially expressed genes by real-time polymerase chain reaction.
We used 18 s rRNA as an internal control. Relative mRNA expression was calculated according to the 2−ΔΔT method. Data are the mean of 10 samples ± SD. Control, gene expression level in the normal colon tissue of mice in the Control group; DMH, gene expression level in the non-tumor colon tissue of mice in the DMH group; DMH+Calcium, gene expression level in the non-tumor colon tissue of mice in the DMH+Calcium group; Calcium, gene expression in the non-tumor colon tissue of mice in the Calcium group. * P value<0.05 between DMH+Calcium group and DMH group; § P value<0.05 between Calcium group and Control group.

