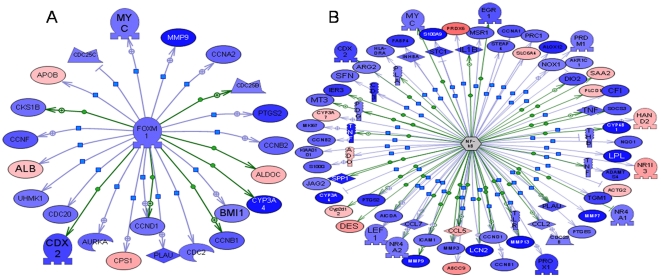
Figure 4. Potential hub genes derived from Pathway studio software.
The differentially expressed genes regulated by the 2 hub genes (A,FoxM1;B, NF-κB) are displayed in form of a network diagram. Green or red coloring, sequences that are downregulated or upregulated in the DMH+Calcium group compared with the DMH group, respectively. The intensity of the color is proportional to the extent of change.

