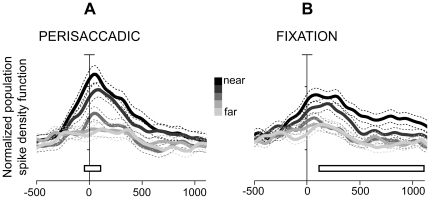
Figure 5. Preference for near space at the population level.
Population activity per each LED position (different tones of grey) of V6A cells modulated in (A) perisaccadic (N = 132) and (B) fixation (N = 193) averaging across all rows. Activity is expressed as averaged normalized SDF (thick lines) with variability bands (s.e.m., dashed lines) and is aligned at saccade onset in both (A) and (B). Each modulated cell was taken into account five times, once for every LED position. The peak of the SDF curve of the LED with maximum activity was set to 1 (or 100%) and was used to normalize the activity curves of the other targets. Accordingly, the population activity of each target is expressed as percentage of the averaged normalized activity. White rectangular boxes indicate the time intervals used at the permutation test (two nearest targets always different form the farthest ones, P<0.05, see text); vertical axis: 10% of normalized activity per division and axis origin corresponds to 20% of normalized activity.

