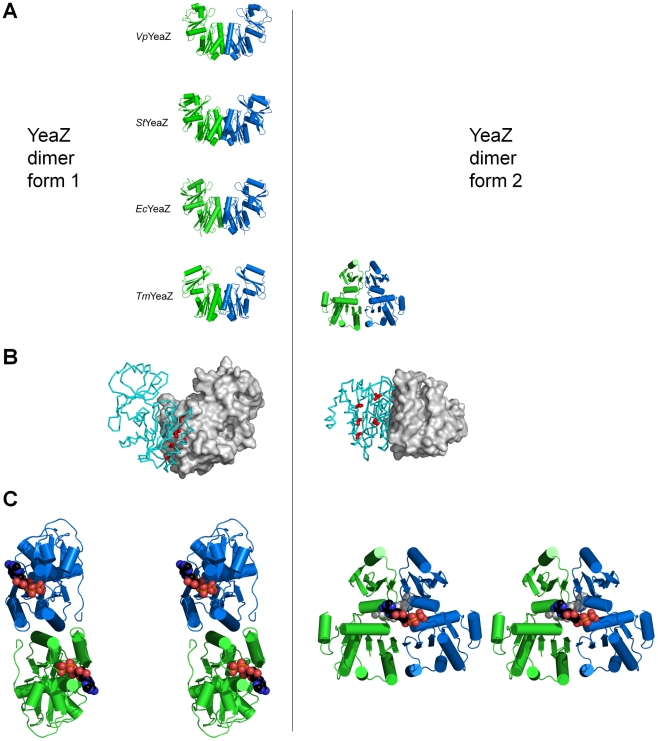
Figure 4. A: Comparison of form 1 and form 2 dimers observed in the crystal structures of VpYeaZ, StYeaZ, EcYeaZ and TmYeaZ.
B: Location of residues L40, L47, I74, I78, L82 (shown in red) at the interface of VpYeaZ dimer (left) and positions of the equivalent residues in TmYeaZ form 2 dimer (right). The residue positions are shown for one half of the dimer, with the other half represented by its molecular surface. C: A stereo diagram showing modeled positions of a nucleotide molecule in the interdomain cleft of the form 1 (left) and the form 2 dimers. The nucleotide (ATP) molecule has been positioned based on structural similarity between domains I in YeaZ and Kae1. The modelled nucleotide is shown in ball representation. In the model of the form 2 dimer complex one of the ATP molecules is shown in light grey for clarity of illustration.

