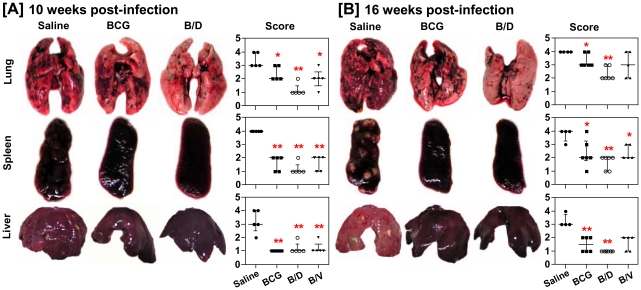
Figure 2. Influence of vaccination on gross pathology following M. tuberculosis infection.
The figure depicts representative photographs and graphical depiction of gross scores of lung, liver and spleen of guinea pigs at (A) 10 weeks (n = 5) and (B) 16 weeks (n = 5) post-infection. Based on the extent of involvement, number and size of tubercles, areas of inflammation and necrosis, gross pathological scores were graded from 1 to 4. Each point represents score for an individual animal and the bar depicts median (± inter-quartile range) for each group, *p<0.05 and **p<0.01, when compared to the saline group (Mann-Whitney U test).

