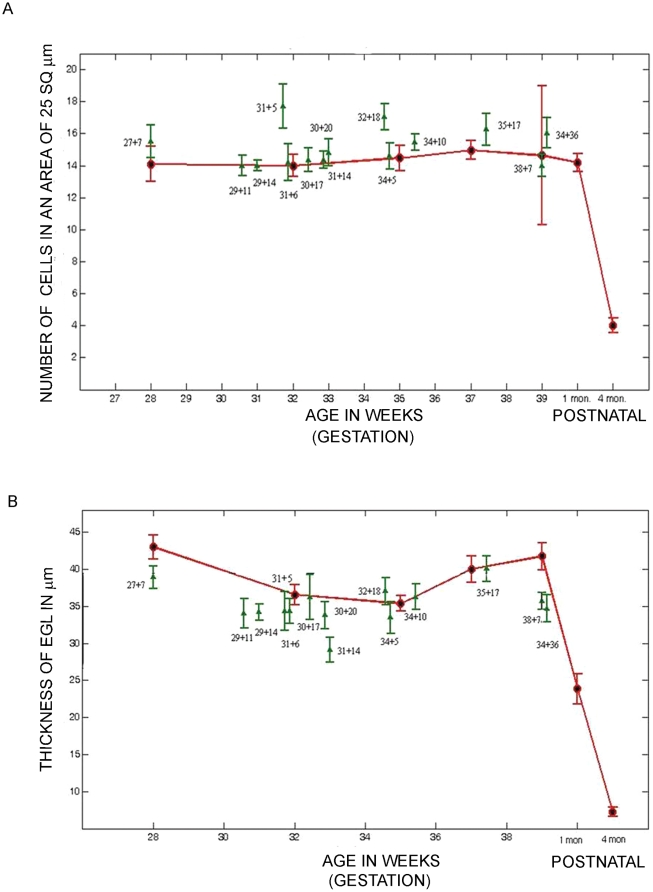
Figure 2. A significant change in EGL cell density and EGL thickness is seen in samples surviving ex-utero.
(A) Graph showing the density of cells in the EGL versus age (B) Graph showing the thickness of the EGL versus age. Data is shown as mean ± standard deviation of multiple measurements from single sample (SD). Red = still born and infants that were born at term and survived postnatally (1–8 months). Green = preterms that survived in an ex-utero environment.

