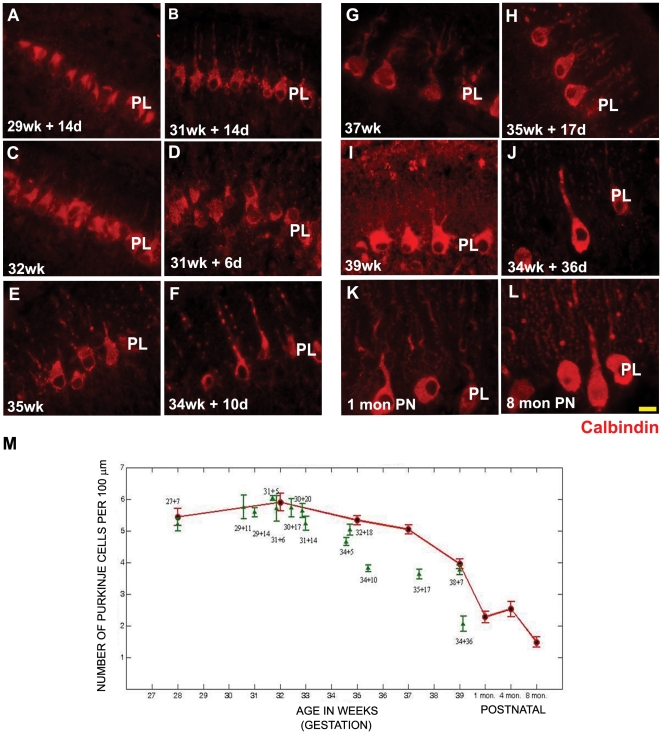
Figure 5. Calbindin positive purkinje cells of the cerebellum.
There is no statistically significant difference in the number of calbindin positive purkinje cells of the cerebellum of preterms with ex-utero survival in comparison to their age matched still born controls (A–L). However the purkinje cell number was seen to decrease in preterms with ex-utero exposure, born after 34 weeks gestation, as compared to their age matched controls. The sections have been stained using calbindin antibody raised in rabbit (red). Abbreviations used - wk = number of gestational weeks, d = number of postnatal days, mon PN = postnatal months - born at term PL = purkinje cell layer. Scale bar = 20 µm (M) Graph showing the number of calbindin positive cells in the PL of the human cerebellum versus age. Data is shown as mean ± standard deviation of multiple measurements from single sample (SD). Red = still born and postnatal survival born at term. Green = preterms that survived in an ex-utero environment.

