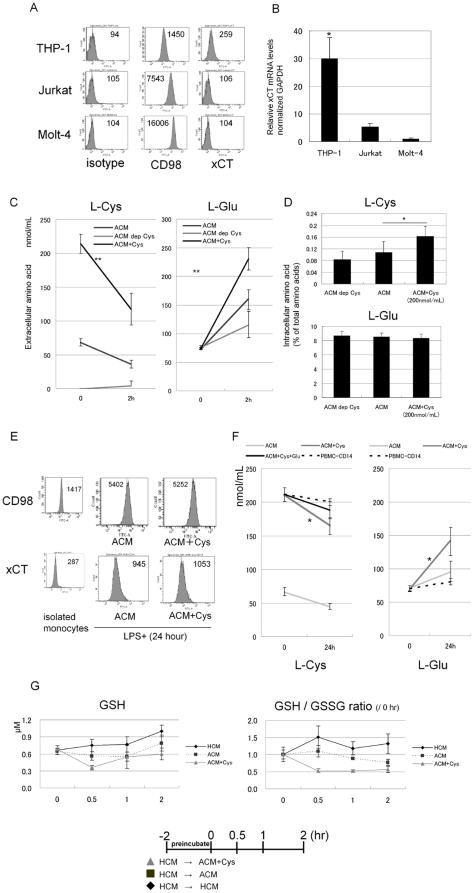
Figure 3. High levels of extracellular L-Cystine promoted the L-Cystine-L-Glutamate antiport via xCT and decreased the intracellular GSH/GSSG ratio in monocyte under the amino acid environment of patients with advanced cirrhosis.
A, THP-1, Jurkat and Molt-4 cultured under CCM were harvested and labeled with antibodies (CD98, xCT or the relevant isotype controls). Using flow cytometry, surface marker expressions were analyzed. The figure expresses the mean fluorescence intensity. Data shown are representative of three independent experiments with cells. B, xCT relative mRNA levels of these cell lines were determined by real time PCR: delta-delta CT method. All mRNA expression levels were normalized to GAPDH. C, D, The THP-1 cells were pre-incubated for 2 hours in ACM, then resusupended with LPS (100 ng/mL) in 1 mL of ACM, L-Cys-free ACM and ACM plus L-Cys. The concentration of extracellular (C) and intracellular (D) amino acid was determined as described in material and methods. E, The CD14+ monocytes, cultured under ACM and ACM plus L-Cys for 24 hours, were harvested and labeled with antibodies (CD98, xCT or the relevant isotype controls). Using flow cytometry, surface marker expressions were analyzed. The figure expresses the mean fluorescence Intensity. Data shown are representative of three independent experiments with cells. F, Similarly as in Fig. 4C, the monocytes were cultured for 24 hours in ACM, L-Cys-free ACM and ACM plus L-Cys. The supernatants were measured by HPLC as extracellular amino acids quantification. G, Monocytes were pre incubated at a density of 2.0×10⁵ cells/well in 96-well flat-bottom plates for 2 hours in HCM, and then cultured in HCM, ACM and ACM plus L-Cys (200 nmol/mL) for an additional 2 hours. These intracellular glutathione levels were measured by GSH-Glo™ at the time point indicated. C and D, Mean ± SD values from five independent experiments are shown. B *, p<0.05 vs Molt-4 (the Mann-Whitney U-test.). C,F **, p<0.01 *,P<0.05 (mean change vs ACM) D *, p<0.05 (paired Student's t test, two-tailed).

