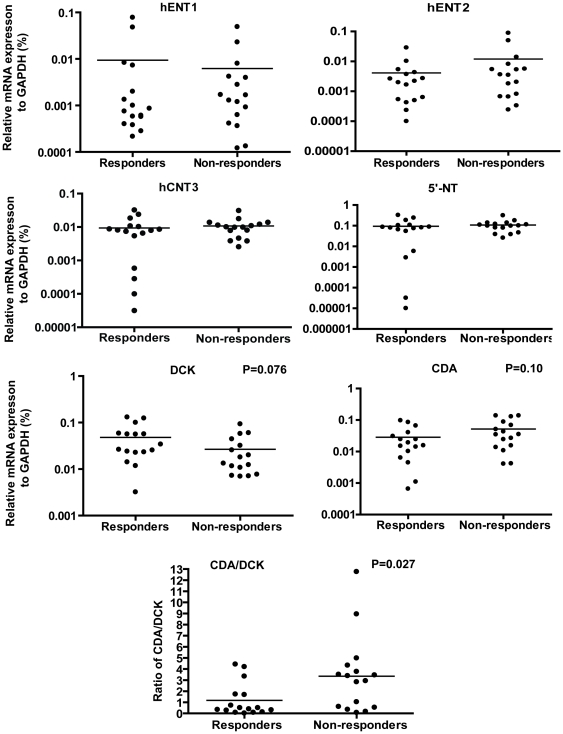
Figure 1. DAC metabolism gene expression in primary resistance.
mRNA expression of genes related to DAC metabolic pathways including hENT1, hENT2, hCNT3, 5′-NT, CDA and DCK were measured by Quantitative Real-Time PCR in 16 responders and 16 non-responders with primary resistance to DAC. GAPDH was used as an internal control. Statistical analysis of the differences in gene expression was performed by unpaired t tests.

