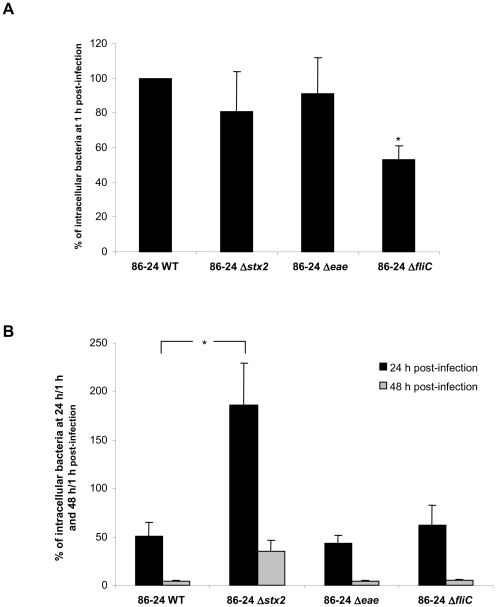
Figure 4. Entry and survival of EHEC strains within THP-1 macrophages.
Percentage of intracellular bacteria at 1 h relative to 86-24 WT taken as 100% (A), and percentage of intracellular bacteria at 24 h/1 h and 48 h/1 h post-infection (B) for EHEC 86-24 WT, and 86-24 Δstx2, 86-24 Δeae, and 86-24 ΔfliC isogenic mutants. All assays were performed independently at least four times. Results are means ± SD for the replicate experiments. Panel A) * 86-24 ΔfliC significantly different from 86-24 WT (P<0.05). Panel B) * 86-24 Δstx2 significantly different from 86-24 WT at 24 h post-infection (P<0.05).

