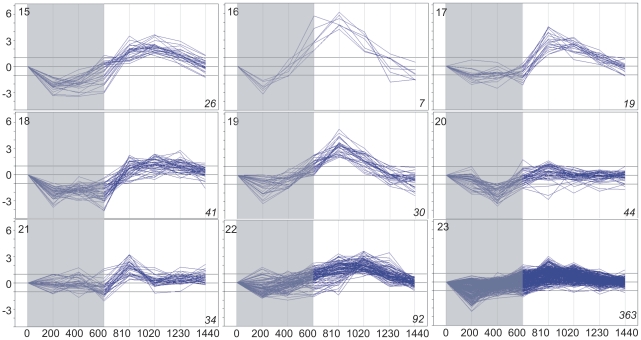
Figure 3. Clustering of diel time-profiles of gene expression in maize leaves in cluster group “day” (clusters 15–23).
Ratio of expression level at a given time to the reference level at time 0 is shown as log2[sample/reference]. Dark period 0–600 min, light period 600–1440 min. Number of profiles in a given cluster is shown in italics in right-hand bottom corner of each plot.

