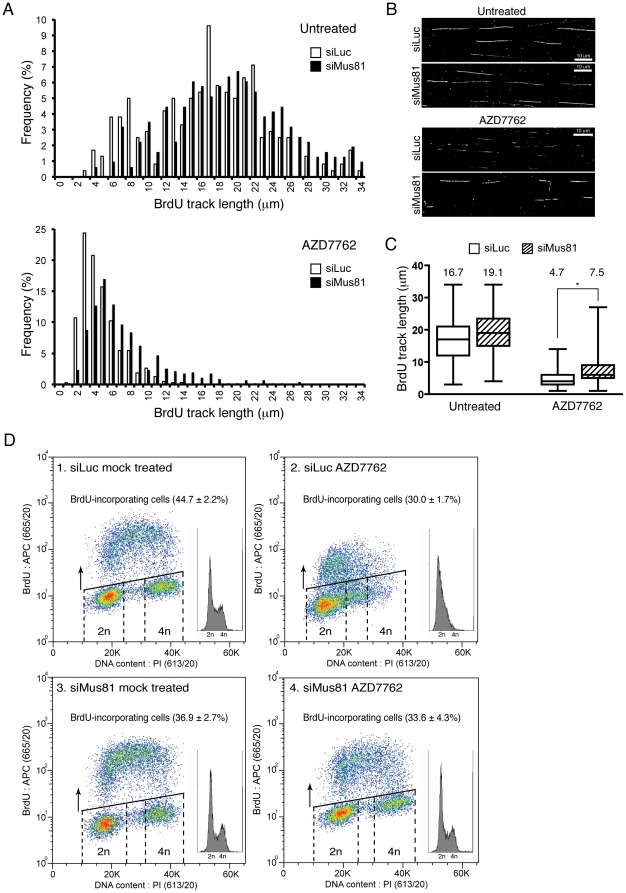
Figure 2. MUS81 depletion allows S-phase progression when Chk1 is inactive.
A. Distribution of BrdU-labelled track lengths in non-treated (top panel) or AZD7762-treated cells (bottom panel). Track lengths were calculated with ImageJ software (NIH). B. Representative images of BrdU-stained replication tracks of non-treated (top) or AZD7762-treated cells (bottom). DNA fibres were visualized with YOYO-1 stain (Invitrogen) to discard broken fibres (not shown). C. Boxplot representation of the distributions of BrdU-labelled track lengths. Average track length values are denoted on top of each boxplot (untreated: siLuc n = 347, siMus81 n = 313; AZD7762-treated: siLuc n = 381, siMus81 n = 414). * Denotes statistically significant difference (p value<0.0001) as calculated using the non-parametric Mann-Whitney test. D. Flow cytometry of replicating cells as measured by BrdU incorporation. The x-axis shows DNA content by propidium iodide (PI) staining; the y-axis measures BrdU incorporation by fluorescence produced with anti-BrdU antibodies. Graphics show representative images for each experiment. Insets show histograms obtained from the same samples. Percentages were calculated from three independent experiments (± SEM). Plots and quantifications were with FlowJo 9.0.2 software (Tree Star). Cells were transfected with siLuc or siMus81#2 and treated as in Fig. 1A.

