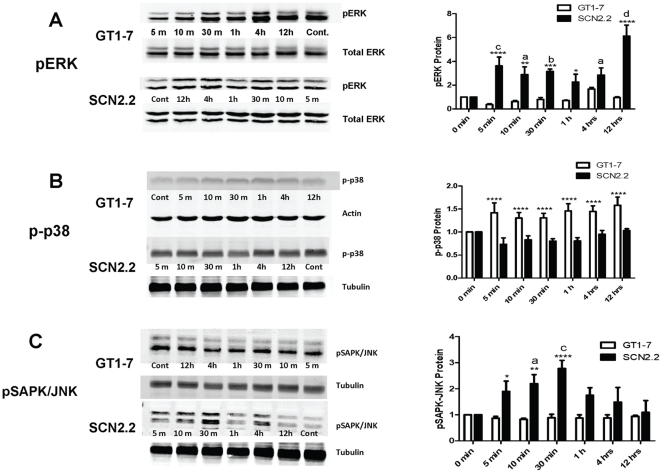
Figure 3. Preferential Activation of ERK/MAPK in Response to Glu in SCN2.2 Cells.
A: Immunoblot for pERK/MAPK in GT1-7 and SCN2.2 cells exposed to 10 mM Glu for 0 min (control), 5 min, 10 min, 30 min, 1 h, 4 h and 12 h. Sample blots are shown on the left, quantification of blots are displayed on the right. B: Immunoblot for p-p38/MAPK in GT1-7 and SCN2.2 cells exposed to 10 mM Glu for the same time periods as in A. Sample blots are shown on the left, quantification of blots are displayed on the right. C: Immunoblot for pSAPK-JNK/MAPK in GT1-7 and SCN2.2 cells exposed to 10 mM Glu for the same time periods as in A. Sample blots are shown on the left, quantification of blots are displayed on the right. All experiments were repeated 3 or 4 times, with n = 1 per experiment. Data were analyzed by two-way ANOVA with post hoc Bonferroni's test. For pERK/MAPK and pSAPK-JNK/MAPK where two-way ANOVA showed a significant interaction between cell type and treatment time, comparisons of GT1-7 vs. SCN2.2 within a time point are indicated by: * = p<0.05; ** = p<0.01; *** = p<0.001, **** = p<0.0001. For pERK/MAPK and pSAPK-JNK/MAPK comparisons of time points vs. control (0 min) within either GT1-7 or SCN2.2 cells are indicated by: a = p<0.05; b = p<0.01; c = p<0.001; d = p<0.0001. For p-p38/MAPK, where two-way ANOVA did not show a significant interaction between cell type and treatment time, comparison between cell types as a whole (not broken down by treatment time) is indicated by **** = p<0.001.

