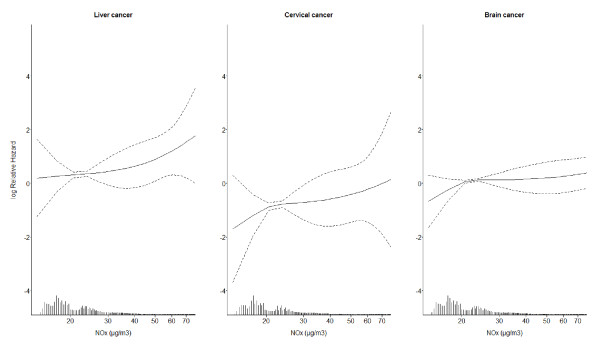
Figure 1.
Non-linear exposure-response functions (filled lines; 95% confidence limits indicated by dashed lines) between average NOx concentration (μg/m3) at residences from 1971 onwards and risks for primary liver cancer, cervical cancer and brain cancer. The functions were adjusted for cancer-specific sets of potential confounders, listed in the last column of Table 2. The figure includes the exposure range between the 5th and 95th percentiles (14.8-69.4 μg/m3 NOx). The exposure distribution is marked on the x-axis.

