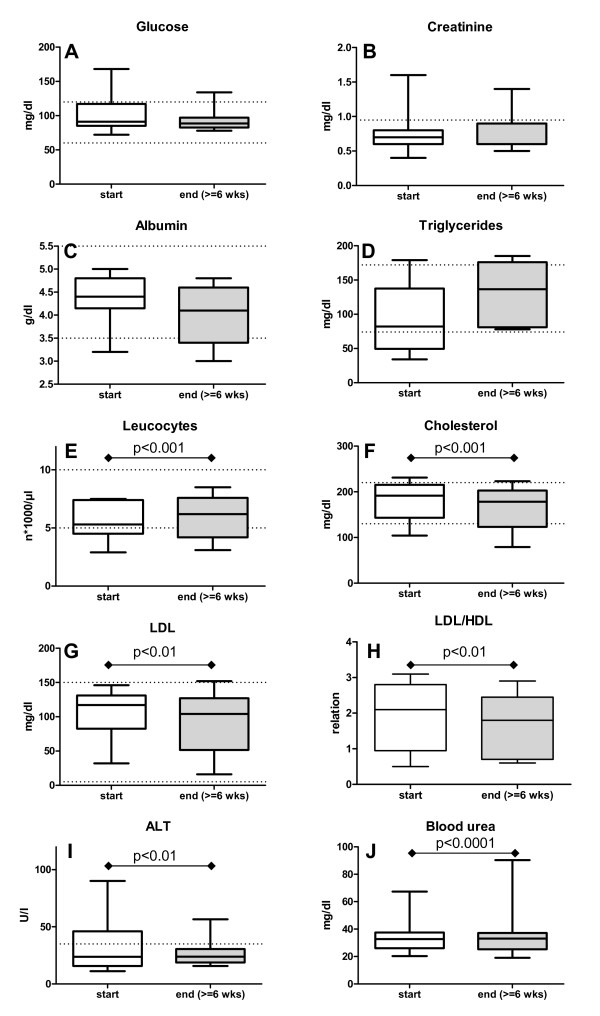
Figure 5.
Blood parameters. The courses of the blood parameters for the 11 evaluable patients at start of study and after at least 6 weeks of dieting are shown. While the blood glucose (A), creatinine (B), albumin (C) and triglycerides (D) did not change much, leukocyte count increased significantly (E) and cholesterol (F), LDL (G) and LDL/HDL (H) decreased significantly. The patients', ALT dropped significantly (I) while blood urea increased, albeit remaining in normal range (J). Dotted lines: upper and lower level of normal range.

