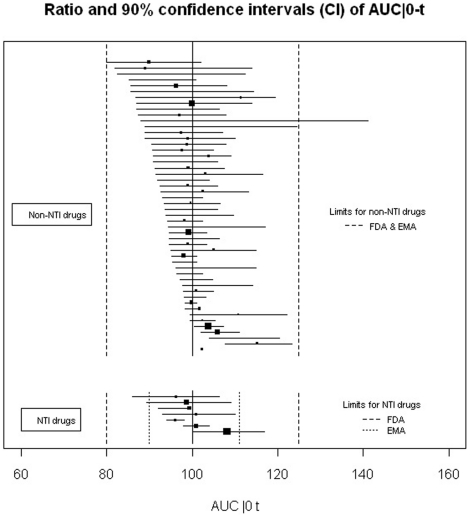
Figure 3. Ratio and 90% confidence intervals for the AUC|0 to t of single-dose bioequivalence trials with a conclusion of bioequivalence.
Black squares indicate ratio; horizontal lines, 90% CI. The size of each square reflects the number of participants enrolled. Limits of acceptance required by both the US Food and Drug Administration (FDA) and the European Medicine Agency (EMA) for confidence intervals of the ratio are within 80% and 125% of the ratio for the generic to brand-name drug.

