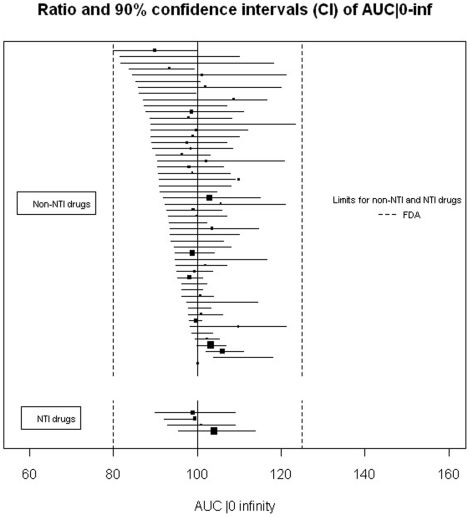
Figure 4. Ratio and 90% confidence intervals for the AUC|0 to infinity of single-dose bioequivalence trials with a conclusion of bioequivalence.
Black squares indicate ratio; horizontal lines, 90% CI. The size of each square reflects the number of participants enrolled. Limits of acceptance required by FDA for confidence intervals of the ratio are within 80% and 125% of the ratio of the generic to brand-name drug.

