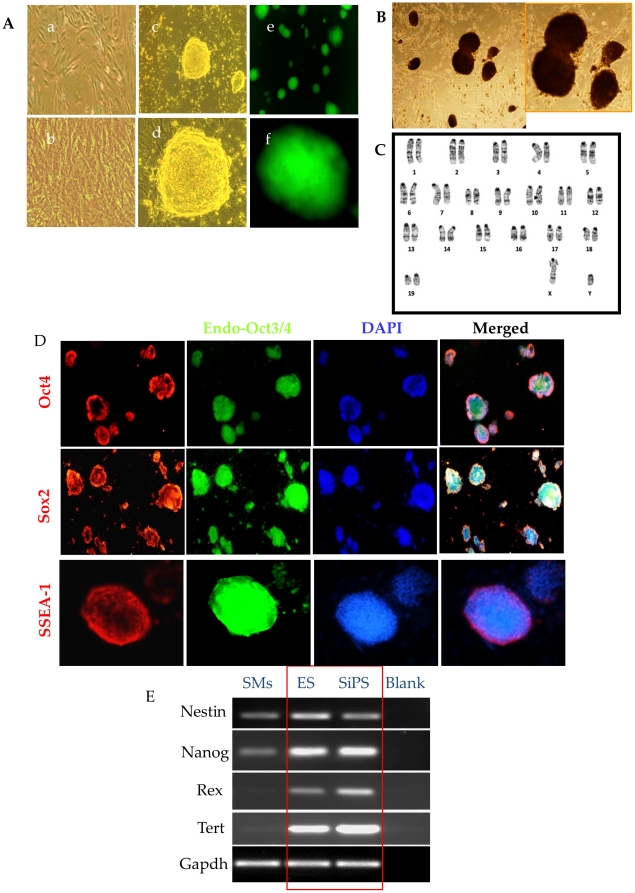
Figure 2. Characterization of SiPS for the expression of pluripotency markers.
(A) Phase-contrast images of SiPS clones from RG108 treatment. Representative photomicrographs showing (a) untreated SMs on day 0 and (b) untreated SMs on day 15 showing fibroblast-like morphology (c–f) Phase-contrast and GFP fluorescent images (green fluorescence) of SiPS clones 15 days after RG108 treatment (B) SiPS clones stained for alkaline phosphatase activity. (C) SiPS clone showing normal karyotyping. (D) Immunostaining of SiPS ZP clone-1 expressing ES cell specific markers Oct3/4, Sox2 and SSEA-1 (red fluorescence) and endogenous Oct4 (green fluorescence). Nuclei were stained with DAPI (blue fluorescence). (E) RT-PCR analyses showing the endogenous gene expression of Nestin, Nanog, Rex-1, and Tert in SMs, ES and SiPS cells.

