
Figure 3.
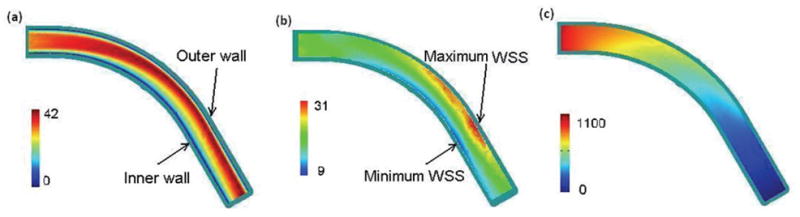
Band plot of (a) the velocity magnitude (cm/s); (b) WSS along the wall (dyne/cm2), and (c) blood pressure in the curvature plane of an initially healthy coronary artery (dyne/cm2), t = 0.85s, η = 0.0245 dyne·s/cm2, Q=1.30.
Official websites use .gov
A
.gov website belongs to an official
government organization in the United States.
Secure .gov websites use HTTPS
A lock (
) or https:// means you've safely
connected to the .gov website. Share sensitive
information only on official, secure websites.
Band plot of (a) the velocity magnitude (cm/s); (b) WSS along the wall (dyne/cm2), and (c) blood pressure in the curvature plane of an initially healthy coronary artery (dyne/cm2), t = 0.85s, η = 0.0245 dyne·s/cm2, Q=1.30.