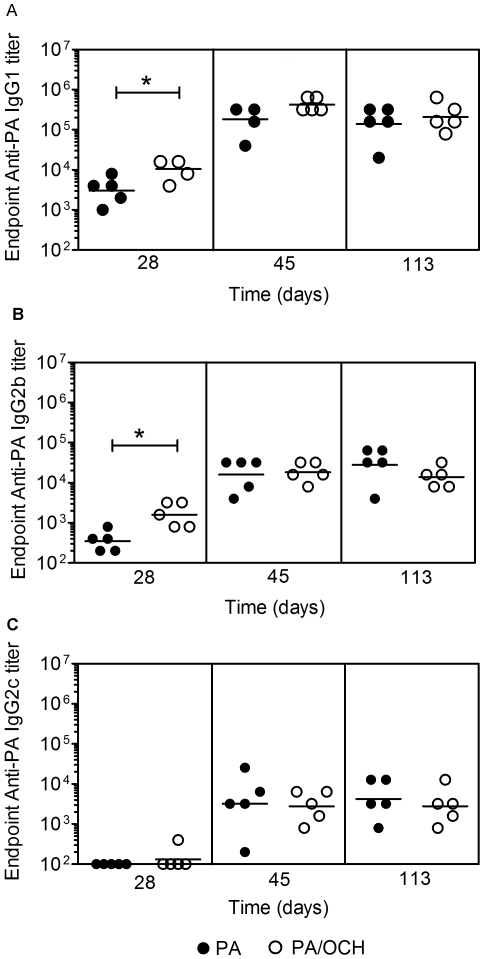
Figure 3. Effect of OCH on PA-specific IgG1, IgG2b and IgG2c response.
C57Bl/6 mice were immunized and bled as described. A Endpoint anti-PA IgG1, B IgG2b and C IgG2c titers were determined by ELISA. Each data point represents an individual mouse (5 per group) and geometric mean titers are shown. Data are representative of two independent experiments. Statistical significance (p<0.05) is indicated by asterisks.

