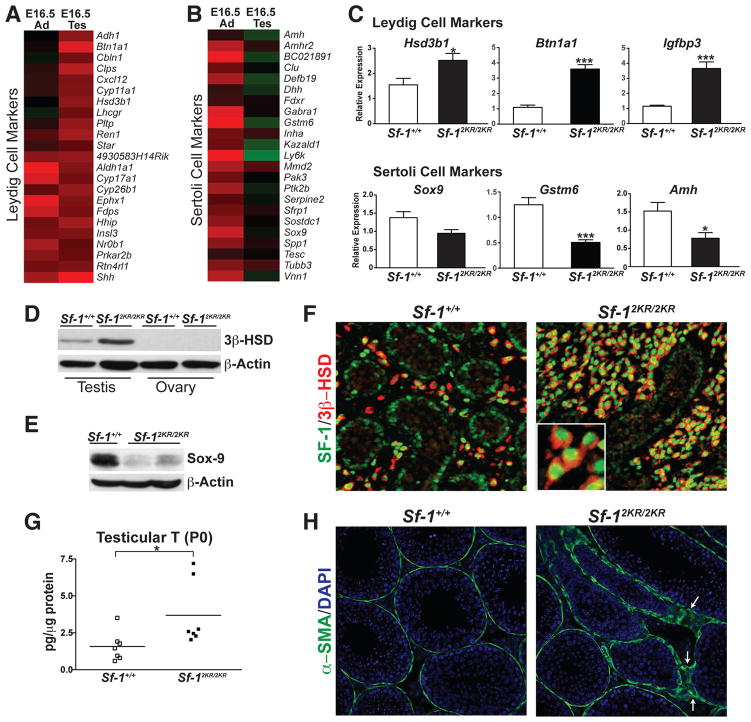
Figure 5. Steroidogenic Leydig cells are expanded in Sf-12KR/2KR mutant testes.
Heat maps showing relative levels (fold over wild type) of Leydig cell markers (A) and Sertoli cell markers (B) in Sf-12KR/2KR mutant testes and adrenals. C. QPCR showed increased expression of Leydig cell markers with a corresponding decrease in Sertoli cell markers in E16.5 Sf-12KR/2KR mutant testes. Western blots of 3β-HSD (D), and SOX9 (E) in E16.5 gonads or testes with β– actin as loading control. F. SF-1 (green) and 3β-HSD (red, marking Leydig cells) staining in E16.5 testes with higher magnification showing nuclear SF-1 and cytoplasmic 3β-HSD staining in mutant interstitial Leydig cells (lower left panel). G. Testosterone levels in mutant and wild type P0 testes. H. Immunofluorescent staining of the peritubular myoid cell marker alpha smooth muscle actin (α-SMA) exhibited an abnormal staining pattern in 4-week old mutant testes (arrows). See Figure S3.

