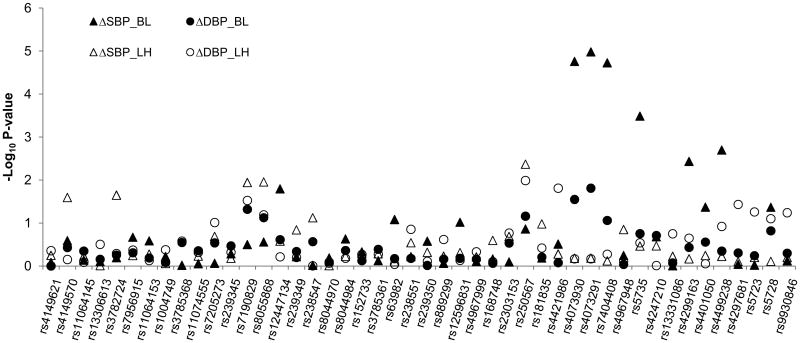
Figure 1.
The log P values for the association between 46 single nucleotide polymorphisms of SCNN1A (a), SCNN1B (b), and SCNN1G (c) genes and blood pressure responses to low- and high-sodium interventions. The horizontal dash line indicates P value of 0.05. ΔSBP_BL, systolic BP changes from baseline to low-sodium intervention; ΔDBP_BL, diastolic BP changes from baseline to low-sodium intervention; ΔSBP_LH, systolic BP changes from low- to high-sodium intervention; ΔDBP_LH, diastolic BP changes from low- to high-sodium intervention.

