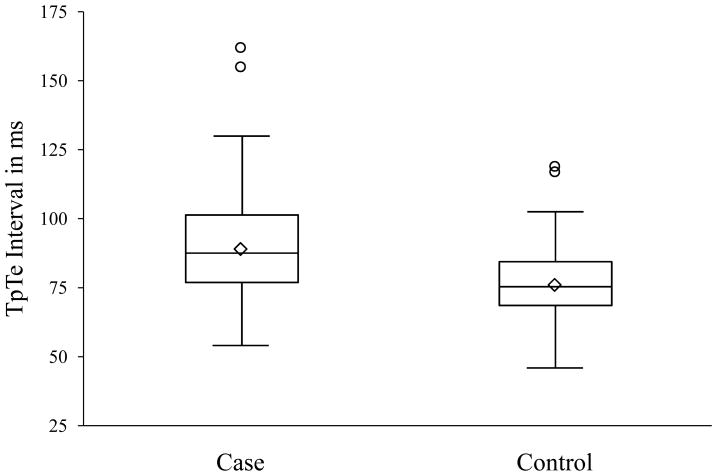
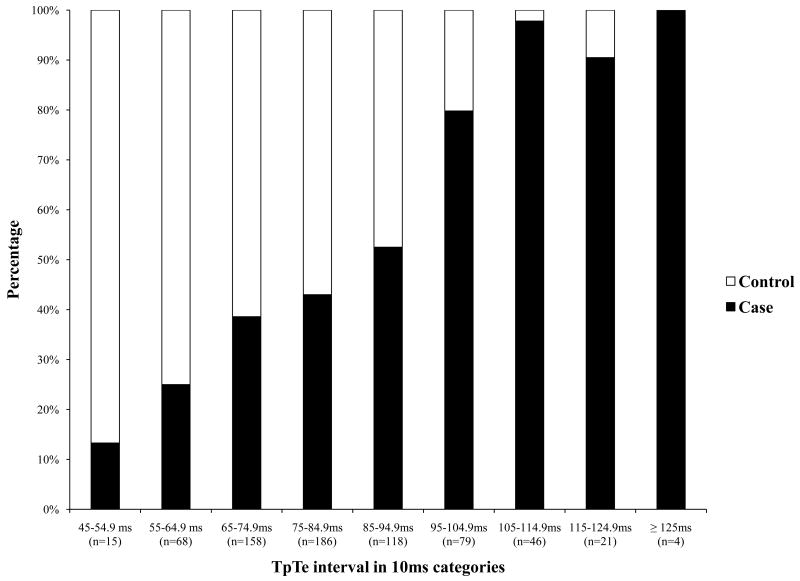
Figure 1.
1A. Box plot of distribution of TpTe interval among cases and controls (TpTe, Tpeak to Tend interval) 1B. Distribution of TpTe interval among cases and controls Bar diagram showing relative clustering of cases towards the higher values of TpTe. Above the interval range 95-104.9ms of TpTe, ≥80% are cases.
(TpTe, Tpeak to Tend interval)


