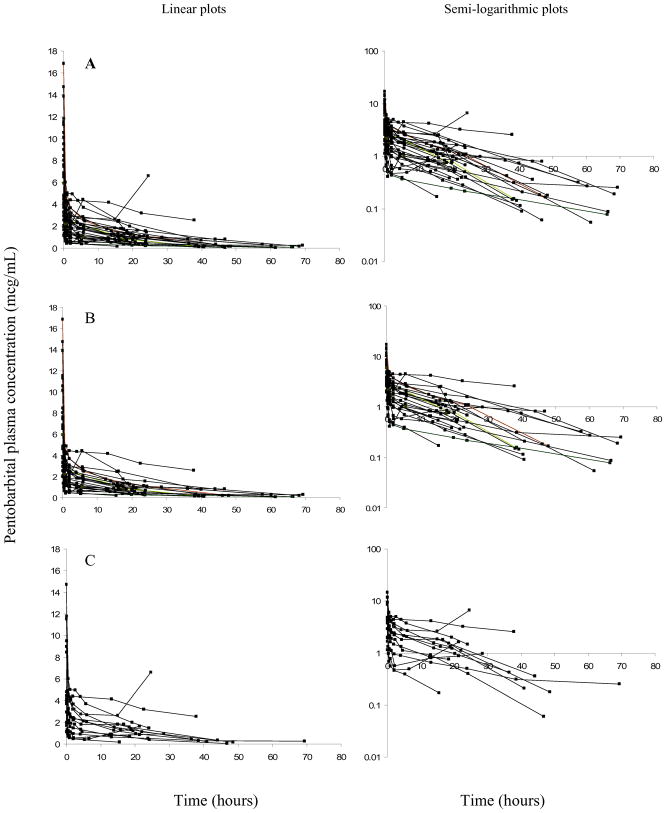
Figure 1.
Concentration-time plots for pentobarbital. Time is from the first bolus. Linear plots are represented on the left, with semi-logarithmic plots represented on the right. “A” panels represents the entire dosing cohort; “B” panels represent subjects who received one bolus; “C” panels subjects who received more than one bolus.

