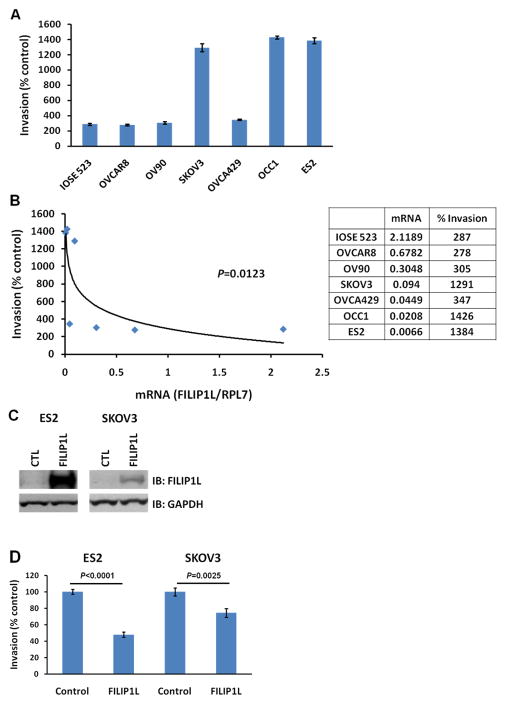
Figure 2. Inverse correlation of FILIP1L expression with the invasive potential of ovarian cell lines.
A, Matrigel cell invasion assay for IOSE and ovarian cancer cell lines. Matrigel invasion was measured using the BD BioCoat Tumor Invasion System as described in Materials and Methods. The y axis represents a percent change over serum-free control. Error bars indicate SEM (n = 4). P value comparison between each cell line and IOSE523 were: NS for OVCAR8 and OV90; p<0.0001 for SKOV3, OCC1 and ES2; p=0.0028 for OVCA429. The result is representative of two independent experiments. B, A significant inverse correlation of the FILIP1L mRNA expression with invasiveness of the cells (p=0.0123 by Spearman’s rank correlation method). y axis; Invasiveness of the cells of a percent change over serum-free control shown in section A was used. x axis; standardized FILIP1L mRNA expression shown in Figure 1A was used. C, Immunoblot analysis for FILIP1L in ES2 and SKOV3 cells transfected with either control or FILIP1LΔC103 cDNA. GAPDH blot is shown as the loading control. The result is representative of three independent experiments. D, Matrigel cell invasion assay for the same cells used in section C. Transfected cells were subject to invasion assay at 24 h after transfection. The same experimental procedures were followed as described in section A. P value comparison was: p<0.0001 for ES2 cells; p=0.0025 for SKOV3 cells. The result is representative of three independent experiments. Representative image of an area scan is shown in Supplementary Figure S2.

