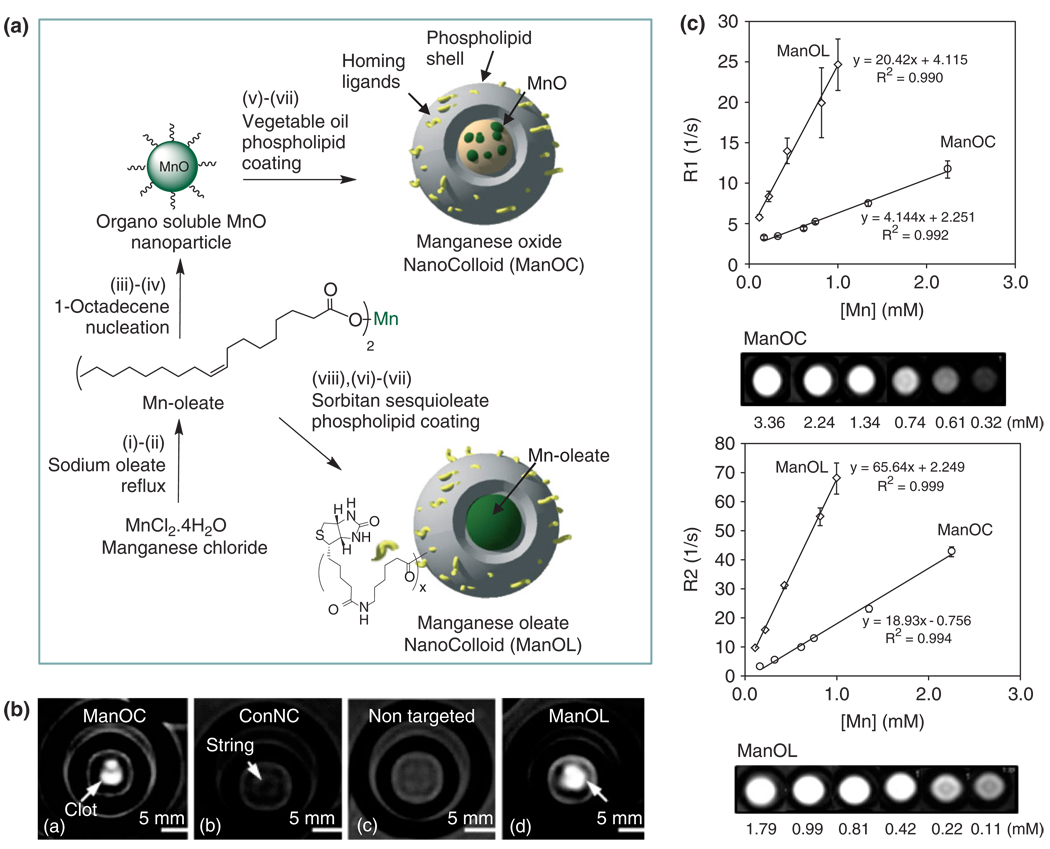
FIGURE 7.
Preparation and characterization of manganese nanocolloids: Reaction conditions: (A) Preparation of ManOC and ManOL. (i)–(ii) sodium oleate, reflux, stirring; (iii)–(iv) 1-octadecene, 325°C/70 min, stirring; (v) suspended with vegetable oil (2 w/v%), vortex, mixing; evaporation of chloroform under reduced pressure, 45°C; (vi) thin film formation from phospholipids mixture; (vii) homogenization, 20,000 psi, 4 min, 0°C; (viii) Mn-oleate, suspended with sorbitan sesquioleate (>2 w/v%), vortex, mixing, evaporation of chloroform under reduced pressure, 45°C; then steps (vi), followed by (vii). (B) MRI images of fibrin-targeted nanocolloids: (a) ManOC; (b) ConNC; (c) nontargeted-ManOL and (d) ManOL, bound to cylindrical plasma clots measured at 3 T (pixel dimension: 0.73 mm × 0.73 mm × 5 mm slice thickness). (C) MR characterization of ManOC and ManOL in suspension: (top) ionic R1 and (bottom) R2 relaxivity. The measured R1 relaxation rate at 3 T for ManOC (circles) and ManOL (diamonds) as a function of manganese concentration. (Reproduced with permission from Ref 38. Copyright 2009 American Chemical Society).

