
Figure 3.
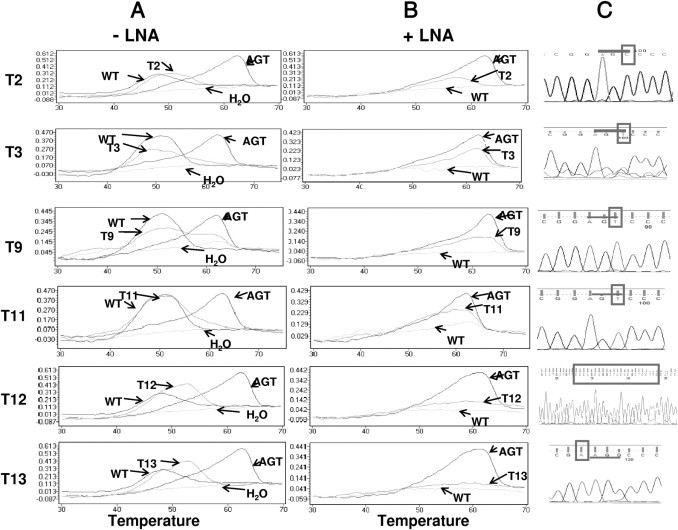
Comparison of melting curve analyses and DNA sequencing chromatograms of the HCC tissue DNA samples that contained the p53 mutation detectable by the p53_249 assay. Melting curves of the PCR products generated in the absence (-) or presence (+) of the LNA clamp using the SimpleProbe SP_249T are shown in A and B. The chromatograms of the sequence of interest, obtained by DNA sequencing analysis of the respective PCR clones, as described in the text, are shown in C. The sequences of the 249 codon are underlined, and the mutated or inserted sequences are boxed. In each reaction, p53_WT and p53_249T templates were used as controls.