Figure 2.
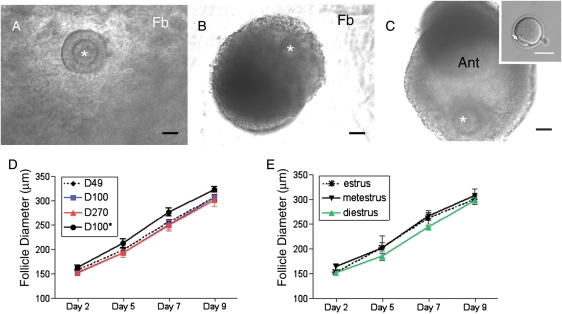
Follicle growth dynamics during culture. Representative images of follicles grown in the FA-IPN 3-D culture system on (A) Day 2, (B) Day 7 and (C) Day 9 of culture (inset shows an MII-arrested oocyte following in vitro maturation, and the polar body is marked by the arrow). Note that the fibrin (Fb) clears during the culture and is a sign of follicle health. The antral cavity (Ant) is evident at Day 9 of culture. The asterisks highlight the position of the oocyte within the follicle. Follicle growth curves are shown for follicles isolated from (D) mice of different ages and weights or (E) from D49 mice at different stages of the estrous cycle. With the exception of follicles isolated from D100* mice which started at a statistically larger size and grew to a statistically larger terminal size compared with follicles isolated from D100 mice (P<0.05), there were no statistically significant differences in follicle growth trajectories among the cohorts examined.

