Figure 3.

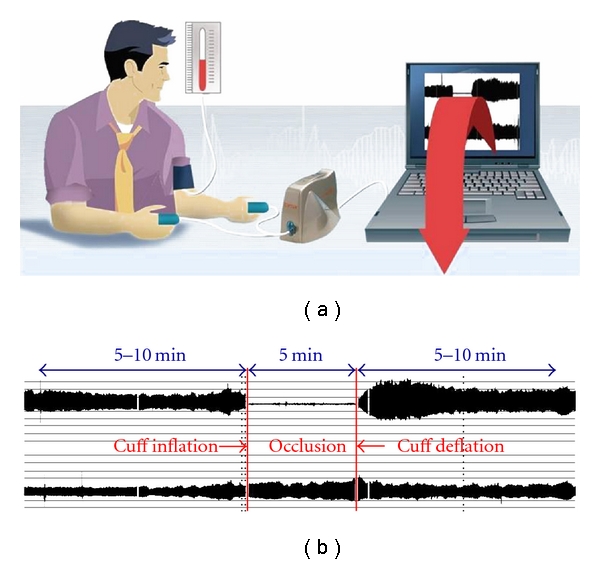
Diagram of the Endo-PAT set-up (a). (b) Representative traces from both the study and control arms showing the changes on the pulse amplitude after a 5-minute period of occlusion (printed with permission of Itamar Medical).

Diagram of the Endo-PAT set-up (a). (b) Representative traces from both the study and control arms showing the changes on the pulse amplitude after a 5-minute period of occlusion (printed with permission of Itamar Medical).